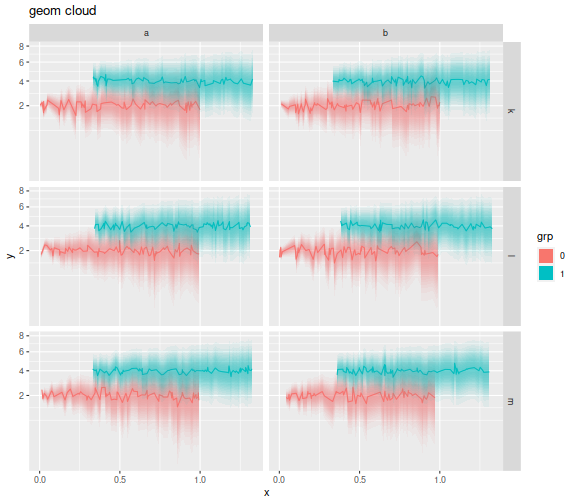
I wanted a drop-in replacement for geom_errorbar in ggplot2 that would
plot a density cloud of uncertainty.
The idea is that typically (well, where I work),
the ymin and ymax of an errorbar are plotted at plus and minus
one standard deviation. A 'cloud' where the alpha is proportional to a normal
density with the same standard deviations could show the same information
on a plot with a little less clutter. I found out how to do this with
a very ugly function, but wanted to do it the 'right' way by spawning my
own geom. So the geom_cloud.
After looking at a bunch of other ggplot2 extensions, some amount of
tinkering and hair-pulling, and we have the following code. The first part
just computes standard deviations which are equally spaced in normal density.
This is then used to create a list of geom_ribbon with equal alpha, but
the right size. A little trickery is used to get the scales right. There
are three parameters: the steps, which control how many ribbons are drawn.
The default value is a little conservative. A larger value, like 15, gives
very smooth clouds. The se_mult is the number of standard deviations that
the ymax and ymin are plotted at, defaulting to 1 here. If you plot
your errorbars at 2 standard errors, change this to 2. The max_alpha is the
alpha at the maximal density, i.e. around y.
# get points equally spaced in density
equal_ses <- function(steps) {
    xend <- c(0,4)
    endpnts <- dnorm(xend)
# perhaps use ppoints instead?
    deql <- seq(from=endpnts[1],to=endpnts[2],length.out=steps+1)
    davg <- (deql[-1] + deql[-length(deql)])/2
# invert
    xeql <- unlist(lapply(davg,function(d) {
                     uniroot(f=function(x) { dnorm(x) - d },interval=xend)$root
    }))
    xeql
}

library(ggplot2)
library(grid)

geom_cloud <- function(mapping = NULL, data = NULL, ...,
                                             na.rm = TRUE,
                                             steps = 7, se_mult=1, max_alpha=1,
                                             inherit.aes = TRUE) {

  layer(
    data = data,
    mapping = mapping,
    stat = "identity",
    geom = GeomCloud,
    position = "identity",
    inherit.aes = inherit.aes,
    params = list(
      na.rm = na.rm,
            steps = steps,
            se_mult = se_mult,
            max_alpha = max_alpha,
      ...
    )
  )
}


GeomCloud <- ggproto("GeomCloud", Geom,
  required_aes = c("x", "y", "ymin", "ymax"),
  non_missing_aes = c("fill"),
  default_aes = aes(
    colour = NA, fill = NA, alpha = 1, size=1, linetype=1
  ),
    setup_data = function(data,params) {
        if (params$na.rm) {
            ok_row <- !(is.na(data$x) | is.na(data$y) | (is.na(data$ymin) & is.na(data$ymax)))
            data <- data[ok_row,]
        }
        ses <- equal_ses(params$steps)
        data$up_se <- (1/params$se_mult) * (data$ymax - data$y)
        data$dn_se <- (1/params$se_mult) * (data$y - data$ymin)
        # a trick to get positions ok: puff up the ymax and ymin for now
        maxse <- max(ses)
        data$ymax  <- data$y + maxse * data$up_se
        data$ymin  <- data$y - maxse * data$dn_se
        data
    },
  draw_group = function(data, panel_scales, coord,
                                                na.rm = TRUE,
                                                steps = 5, se_mult=1, max_alpha=1) {

        data$alpha <- max_alpha / steps
        # 2FIX: use the coordinate transform? or just forget it?
        ses <- equal_ses(steps)
        grobs <- Map(function(myse) {
                                     this_data <- data
                                     this_data$ymax <- this_data$y + myse * this_data$up_se
                                     this_data$ymin <- this_data$y - myse * this_data$dn_se
                                     ggplot2::GeomRibbon$draw_group(this_data, panel_scales, coord, na.rm=na.rm)
                                                },ses)
        do.call("gList",grobs)
  },
    draw_key = draw_key_polygon
)
Ok, now I use it. I construct some data in multiple groups, splitting into column and row facets by some random variable. Within each facet there are two groups. The standard error is proportional to square root x. I then plot the clouds. I put these in square root space to convince myself I had not goofed up scale transformations. (Well, still not sure, really.)
library(dplyr)

nobs <- 1000

set.seed(2134)
mydat <- data.frame(grp=sample(c(0,1),nobs,replace=TRUE),
                                        colfac=sample(letters[1:2],nobs,replace=TRUE),
                                        rowfac=sample(letters[10 + (1:3)],nobs,replace=TRUE)) %>%
    mutate(x=seq(0,1,length.out=nobs) + 0.33 * grp) %>%
    mutate(y=0.25*rnorm(nobs) + 2*grp) %>%
    mutate(grp=factor(grp)) %>%
    mutate(se=sqrt(x)) %>%
    mutate(ymin=y-se,ymax=y+se)

offs <- 2
ph <- mydat %>%
    mutate(y=y+offs,ymin=ymin+offs,ymax=ymax+offs) %>%
    ggplot(aes(x=x,y=y,ymin=ymin,ymax=ymax,color=grp,fill=grp)) +
    facet_grid(rowfac ~ colfac) +
    scale_y_sqrt() + geom_line() +
    geom_cloud(aes(fill=grp),steps=15,max_alpha=0.85,color=NA) +   # important!  set color to NA!
    labs(title='geom cloud')
print(ph)

At some point I will put this in a package or try to push it off into one of
the fine ggplot2 extension packages. There are still some bugs to be worked
out: I would like the fill to default to the color if the fill is not given.
I want to force the color to be NA, otherwise geom_ribbon adds really
ugly lines, and so on.